Black Hole Mass
Black holes are ubiquitous in the Universe and come in many different sizes (and masses). A black hole can be fully characterized through its mass and its spin. Black holes are typically sub-divided according to their mass into stellar-mass black holes (roughly a few tens of solar masses) and supermassive black holes (a million solar masses or more). There are also the elusive intermediate mass black holes (anywhere in between a few hundred to a few hundred thousand solar masses), which are thought to bridge the gap between stellar and supermassive black holes, but which have been difficult to find (see here for an expert on these exotic objects).
Stellar mass black holes are the final evolution stage of very massive stars, which usually end their lives in spectacular explostions that shed their outer mantels into space, leaving a black hole behind. The formation of supermassive black holes on the other hand is still intensely debated, be it through the rapid accretion of matter onto stellar black holes, less rapid accretion onto intermediate-mass black holes, or even direct collapse of large gaseous clouds in the very early Universe.
Calculating black hole masses
To characterize a black hole, its accretion properties, and its sphere of influence, its mass need to be known. The most accurate way we know of how to calculate a black hole's mass is through its direct gravitational influence on celestial bodies around them (i.e., stars). This has been beautifully accomplished for our very own supermassive black hole at the center of the Milky Way, and for some other very nearby galaxies. However, this method is very limited due to limitation on our telescopes resolving power.
Alternatively, people have used more indirect methods that rely on simple assumptions about gas moving in the gravitational field of the black hole. If we assume that the gas around a black hole is virialized, then based on its velocity and its distance from the black hole we can deduce the mass of the object (the black hole) excerting the force on the gas. The reverberation mapping technique cleverly relies on the variable nature of accretion onto supermassive black holes to deduce the size of the region of the emitting gas and together with the knowledge of the gas velocity, it can get accurate estimations of the black hole mass (on the assumption of virial equilibrium).
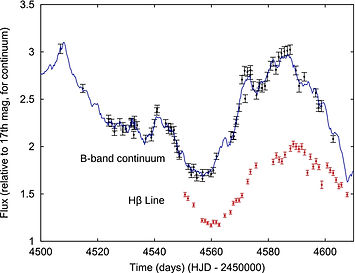
By comparing the lightcurves of continuum (accretion disk) and emission lines (gas), one can calculate the time the light takes to travel between the very center of the AGN and the region where the ionized gas is and therefore the size of that region. The emission coming from the gas can also reveal its projected line-of-sigh velocity (due to Doppler broadening). Figure from Barth et al. (2011).
Black hole masses: the quick and dirty way
Based on the detailed reverberation mapping studies, it was revealed the size of the broad line emitting region is actually proportional to the luminosity of the AGN (either continuum or emission line). As a result, one could skip the painfull process of monitoring an AGN and instead use singe epoch measurements of its luminosity and gas velocity and get a fairly accurate estimate of its black hole mass. For this purpose one needs to use emission coming from ionized gas that is very close to the black hole, so that the virial assumption stands.
Traditionally, the Balmer emission lines have been used to get virial mass estimates of the black hole mass. However, as our interest shifted to galaxies farther away from us, the Balmer lines (Hα and Hβ) shifted out of the visible window due to the cosmological redshift. As a result, alternatives were sought and found in the rest-frame ultra-violet part of the spectrum. These are the magnesium (MgII) and carbon emission lines (CIV and CIII]). Using these lines requires detailed calibration against both reverberation mapping results as well as single epoch Balmer line black hole mass measurements.
We recently acquired near-infrared spectra of a large sample of AGN, which allowed us to measure their Balmer emission lines. We were therefore able to compare the Balmer black hole mass estimates with estimates based on rest-frame UV lines (MgII, CIV, and CIII]). We explored the comparison between these two sets of lines and measured the scatter around the expected slope of one (~0.35 for carbon-based and ~0.25 for magnesium-based mass estimators). We also compiled a large literature sample of similar measurements, which helped us extend the dynamical range of black hole masses we could study and allowed us to make a robust calculation of the virial factor (a fudge factor that translates the product of emission line region size and gas velocity into black hole mass) for carbon-based black hole mass estimation.
Related papers: Karouzos et al. 2015a
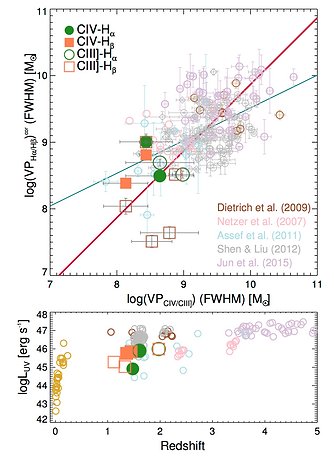

Left: Comparison between carbon-based and hydrogen-based virial products for our sample (orange and green points) and samples from the literature. Our sample has lower luminosity than previous studies at similar redshifts. Right: Comparison between magnesium-based and hydrogen-based virial products for our sample (blue, green, and black points) and samples from the literature.